Zipkin At Curalate ¬
Curalate uses a micro-services infrastructure (SOA) to power its products. As the number of services began to grow, tracking down performance issues became more difficult due to the increasing number of distributed dependencies. To help identify and fix these issues more quickly, we wanted to utilize a distributed tracing infrastructure. The main goals were:
- Standardize on performance tracing across services
- Generation of trace identifiers that flow throughout the platform
- Identify and examine outliers in near real-time
- Collection of performance data that could also be post-processed
- Easy for developers to add trace points
After evaluating several distributed tracing solutions, we chose Zipkin. Zipkin is an open source Distributed Tracing project released by Twitter that is based on the ideas behind Google’s Dapper. Since a majority of our services were already based on Finagle, Twitter’s open source RPC system, using Zipkin is a natural fit.
What are the main benefits of Zipkin?
Performance and Dependency Visualization
Zipkin allows you to quickly visualize complex requests, gaining insight into the timing, performance and dependencies. Here is an example trace from our QA environment (with names altered):
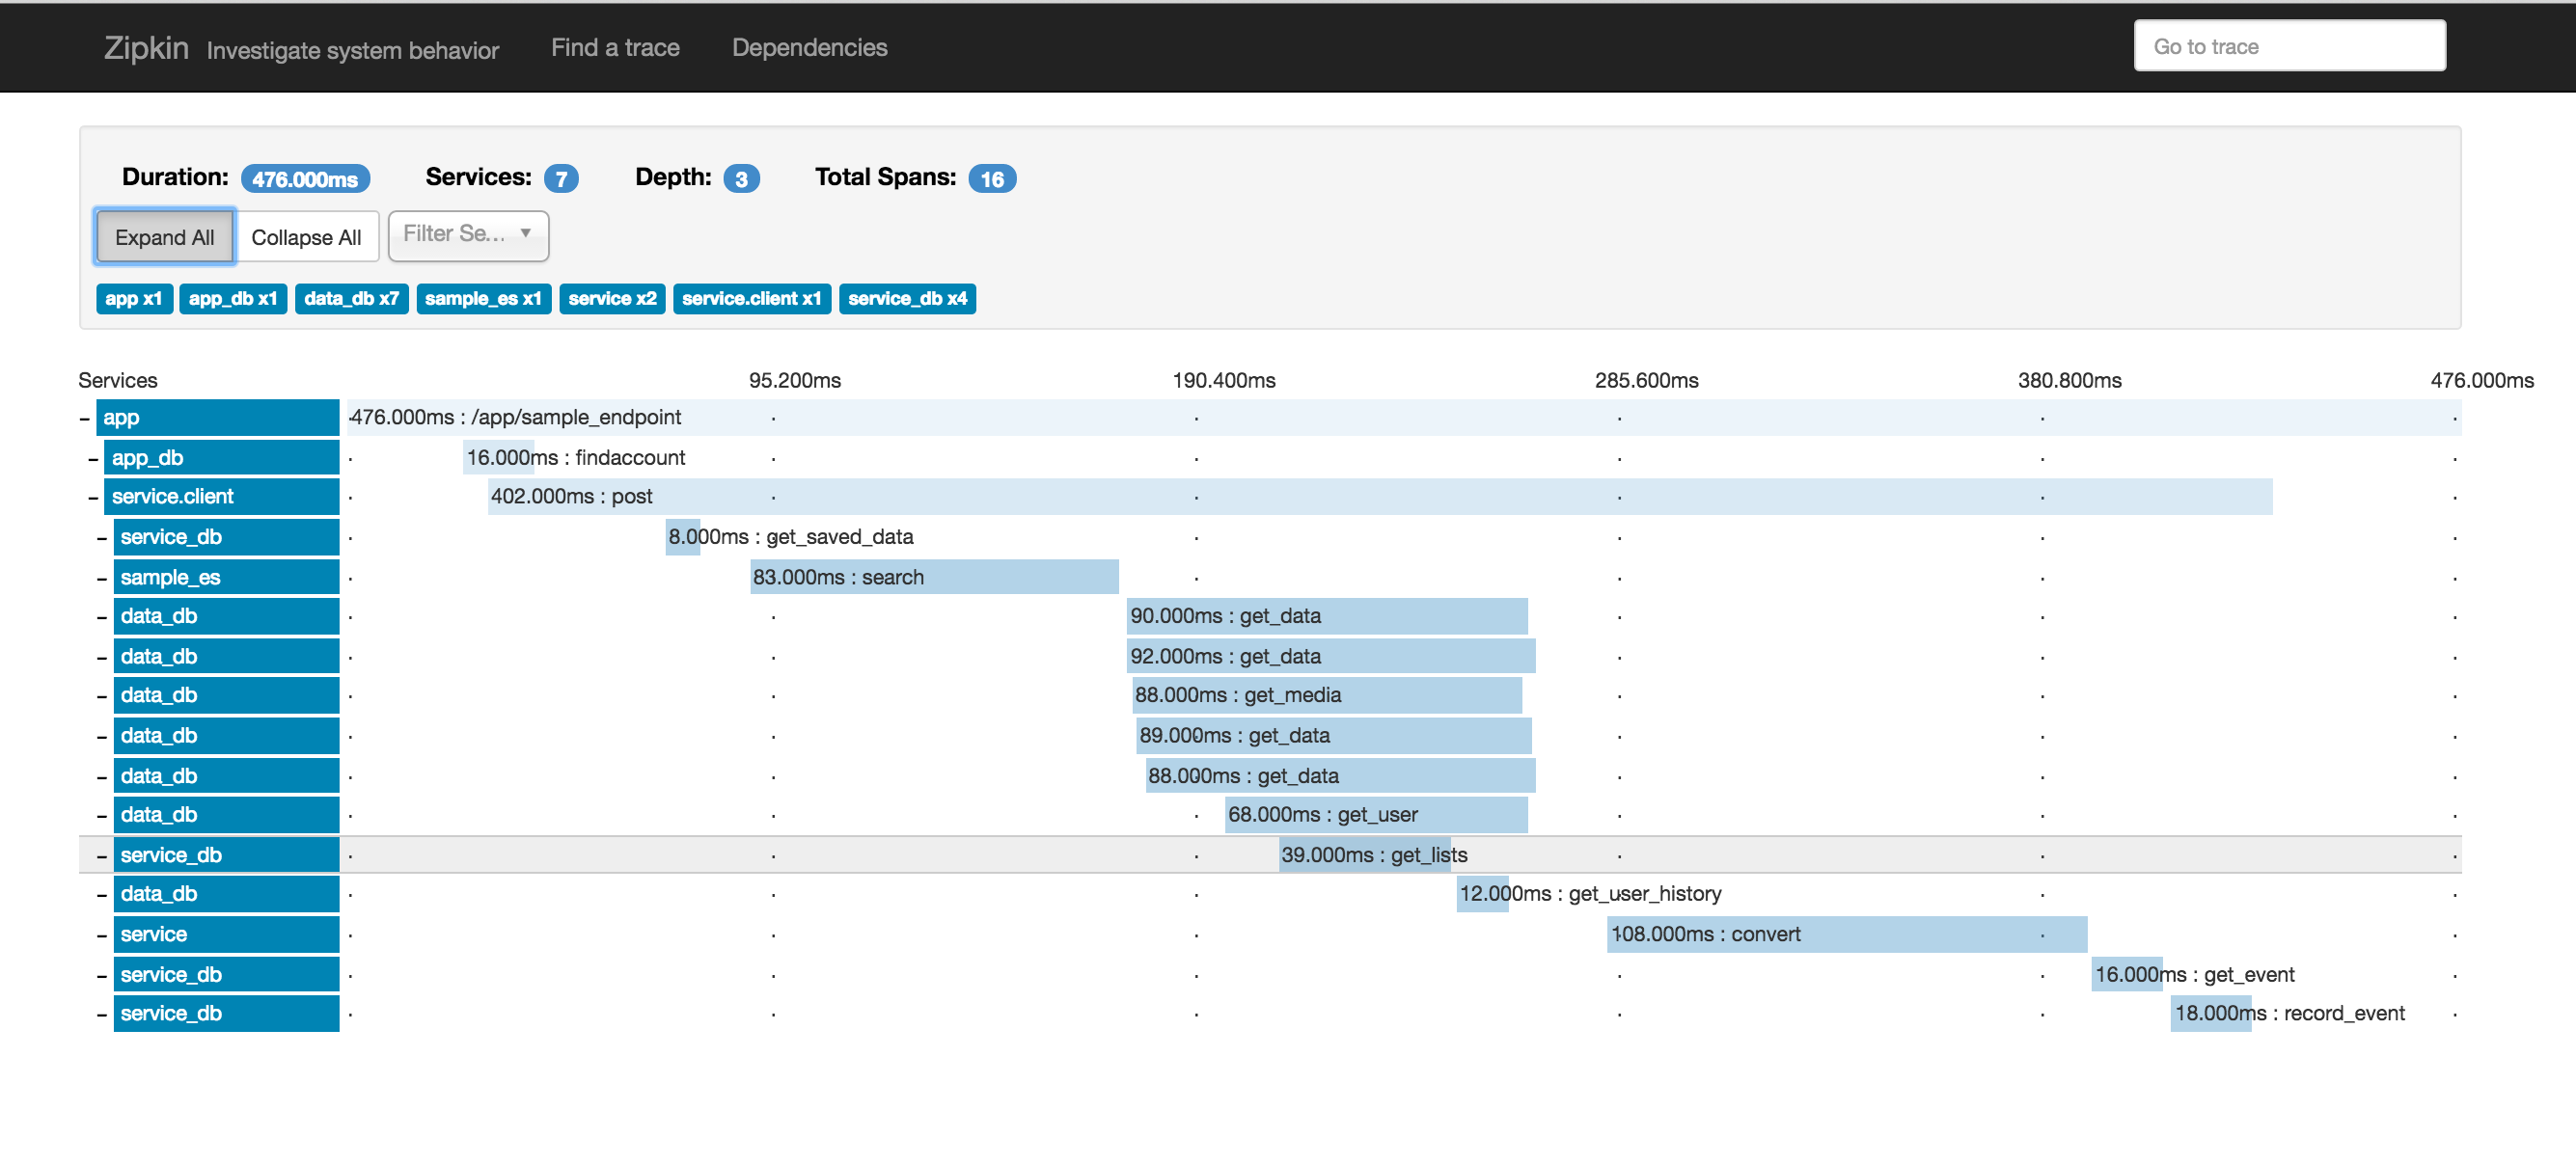
Traces can be queried based on endpoint, service, or even using custom trace annotations. For example, display requests that occurred in the last hour targeting object “foo” that were greater than 250 ms.
The Zipkin Project
The Zipkin project has done a majority of the heavy lifting! They separated trace generation, collection, storage, and display to allow for trace collection at large scale. The project provides the following components:
- Collector: Reads traces from Transport layer (Kafka, HTTP, Scribe) and writes them to a storage layer (MySQL, Cassandra, ElasticSearch, etc.)
- Query Server: Queries the storage layer for relevant traces
- Web Server: UI that access the Query component for traces
Depending on your trace throughput requirements, you can choose the trace transport, storage and number of collectors to fit your needs.
The amount of actual tracing-related code needed to generate a trace similar to the example above is quite small. We only needed to add a few tracing wrappers, a filter on the incoming requests, and trace points where non-finagle services are accessed (since any finagle-based access gets traced automatically).
Finally, Zipkin also has an active open source community and is under active development. For instance, they recently combined the Query and Web server components and added ElasticSearch as an additional storage option. And it isn’t hard to find others using Zipkin on the web too.
Pitfalls
Why didn’t my trace show up?
Curalate uses Scala as its main language for backend infrastructure. The Zipkin trace identifiers are stored in Twitter Locals (i.e. thread local storage). Our codebase contains a mix of threading models and thread pools. Making sure the current trace identifier can be accessed from any thread without explicitly passing it around required overriding the standard Scala thread-pools. There were quite a few times during development when a trace point was not logged as expected.
MySQL as the storage layer
MySQL was great for getting up a quick proof of concept and the initial roll out. However, as we increase the number of traces being sampled, MySQL is becoming a bottleneck on both the trace ingest and serving side. The good news is that we knew this possibility going in, and swapping out storage options (for Cassandra or ElasticSearch) should be relatively painless.
Final Thoughts
We have had Zipkin deployed for a few months now. The tracing pipeline is stable, and with the help of Zipkin we have identified and fixed several performance issues across multiple services. It is great to have another tool in our distributed systems tool belt!

John Boyles was a Software Engineer at Curalate.