Productionalizing ECS ¬
In January of last year we decided as a company to move towards containerization and began a migration to move onto AWS ECS. We pushed to move to containers, and off of AMI based VM deployments, in order to speed up our deployments, simplify our build tooling (since it only has to work on containers), get the benefits of being able to run our production code in a sandbox even locally on our dev machines (something you can’t really do easily with AMI’s), and lower our costs by getting more out of the resources we’re already paying for.
However, making ECS production ready was actually quite the challenge. In this post I’ll discuss:
- Scaling the underlying ECS cluster
- Upgrading the backing cluster images
- Monitoring our containers
- Cleanup of images, container artifacts
- Remote debugging of our JVM processes
Which is a short summary of the things we encountered and our solutions, finally making ECS a set it and forget it system.
Scaling the cluster
The first thing we struggled with was how to scale our cluster. ECS is a container orchestrator, analogous to Kubernetes or Rancher, but you still need to have a set of EC2 machines to run as a cluster. The machines all need to have the ECS Docker agent installed on it and ECS doesn’t provide a way to automatically scale and manage your cluster for you. While this has changed recently with the announcement of Fargate, Fargate’s pricing makes it cost prohibitive for organizations with a lot of containers.
The general recommendation that AWS gave with ECS was to scale based on CPU reservation limit OR memory limit. There’s no clear way to scale with a combination of the two, since auto scaling rules need to apply to a single CloudWatch metric or you face potential thrashing.
Our first attempt on scaling was to try and scale on container placement failures. ECS logs a message when containers are unable to be placed due to constraints (not enough memory on the cluster, or not enough CPU reservation left), but there is no way to actually capture that event programmatically (see this github issue). The goal here was to not preemptively scale, but instead scale on actual pressure. This way we wouldn’t be overpaying for machines in the cluster that aren’t heavily used. However we had to discard this idea since it wasn’t possible due to API limitations.
Our second attempt, and one that we have been using now in production, is to use an AWS Lambda function to monitor the memory and CPU reservation of the cluster and emit a compound metric to CloudWatch that we can scale on. We set a compound threshold with the logic of:
- If either memory or CPU is above the max threshold, scale up
- Else if both memory and CPU are below the min, scale down.
- Else stay the same
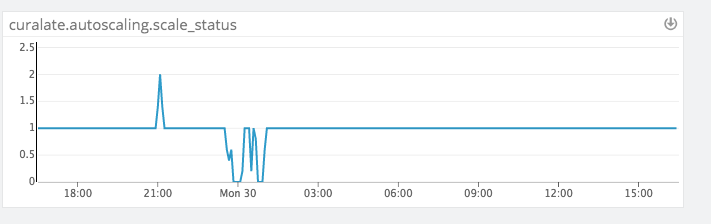
We represent a scale up event with a CloudWatch value of 2, a scale down as value 0 and otherwise the nominal state as value 1.
The code for that is shown below:
package com.curalate.lambdas.ecs_scaling

import com.amazonaws.services.CloudWatch.AmazonCloudWatch
import com.amazonaws.services.CloudWatch.model._
import com.curalate.lambdas.ecs_scaling.ScaleMetric.ScaleMetric
import com.curalate.lambdas.ecs_scaling.config.ClusterScaling
import org.joda.time.DateTime
import scala.collection.JavaConverters._

object ScaleMetric extends Enumeration {
  type ScaleMetric = Value

  val ScaleDown = Value(0)
  val StaySame = Value(1)
  val ScaleUp = Value(2)
}

case class ClusterMetric(
  clusterName: String,
  scaleMetric: ScaleMetric,
  periodSeconds: Int
)

class MetricResolver(clusterName: String, cloudWatch: AmazonCloudWatch) {
  private lazy val now = DateTime.now()
  private lazy val start = now.minusMinutes(3)

  private val dimension = new Dimension().withName("ClusterName").withValue(clusterName)

  val periodSeconds = 60

  protected def getMetric(name: String): Double = {
    val baseRequest = new GetMetricStatisticsRequest().withDimensions(dimension)

    cloudWatch.getMetricStatistics(baseRequest.
      withMetricName(name).
      withNamespace("AWS/ECS").
      withStartTime(start.toDate).
      withEndTime(now.toDate).
      withPeriod(periodSeconds).
      withStatistics(Statistic.Maximum)
    ).getDatapoints.asScala.head.getMaximum
  }

  lazy val currentCpuReservation: Double = getMetric("CPUReservation")

  lazy val currentMemoryReservation: Double = getMetric("MemoryReservation")
}

class ClusterStatus(
  scaling: ClusterScaling,
  metricResolver: MetricResolver
) {

  protected val logger = org.slf4j.LoggerFactory.getLogger(getClass)

  def getCompositeMetric(): ClusterMetric = {
    logger.info(s"CPU: ${metricResolver.currentCpuReservation}, memory: ${metricResolver.currentMemoryReservation}")

    val state =
      if (metricResolver.currentCpuReservation >= scaling.CPU.max || metricResolver.currentMemoryReservation >= scaling.memory.max) {
        ScaleMetric.ScaleUp
      }
      else if (metricResolver.currentCpuReservation <= scaling.CPU.min && metricResolver.currentMemoryReservation <= scaling.memory.min) {
        ScaleMetric.ScaleDown
      } else {
        ScaleMetric.StaySame
      }

    ClusterMetric(scaling.name, state, metricResolver.periodSeconds)
  }
}

class CloudwatchEmitter(cloudWatch: AmazonCloudWatch) {
  def writeMetric(metric: ClusterMetric): Unit = {
    val cluster = new Dimension().withName("ClusterName").withValue(metric.clusterName)

    cloudWatch.putMetricData(new PutMetricDataRequest().
      withMetricData(new MetricDatum().
        withMetricName("ScaleStatus").
        withDimensions(cluster).
        withTimestamp(DateTime.now().toDate).
        withStorageResolution(metric.periodSeconds).
        withValue(metric.scaleMetric.id.toDouble)
      ).withNamespace("Curalate/AutoScaling"))
  }
}
Wiring in our ECS cluster to autoscale on this metric value in our Terraform configuration looks like
resource "aws_cloudwatch_metric_alarm" "cluster_scale_status_high_blue" {
  count               = "${var.autoscale_enabled}"
  alarm_name          = "${var.cluster_name}_ScaleStatus_high_blue"
  comparison_operator = "${lookup(var.alarm_high, "comparison_operator")}"
  evaluation_periods  = "${lookup(var.alarm_high, "evaluation_periods")}"
  period              = "${lookup(var.alarm_high, "period")}"
  statistic           = "${lookup(var.alarm_high, "statistic")}"
  threshold           = "${lookup(var.alarm_high, "threshold")}"
  metric_name         = "ScaleStatus"
  namespace           = "Curalate/AutoScaling"

  dimensions {
    ClusterName = "${var.cluster_name}"
  }

  alarm_description = "High cluster resource usage"
  alarm_actions     = ["${aws_autoscaling_policy.scale_up_blue.arn}"]
}

resource "aws_cloudwatch_metric_alarm" "cluster_scale_status_low_blue" {
  count               = "${var.autoscale_enabled}"
  alarm_name          = "${var.cluster_name}_ScaleStatus_low_blue"
  comparison_operator = "${lookup(var.alarm_low, "comparison_operator")}"
  evaluation_periods  = "${lookup(var.alarm_low, "evaluation_periods")}"
  period              = "${lookup(var.alarm_low, "period")}"
  statistic           = "${lookup(var.alarm_low, "statistic")}"
  threshold           = "${lookup(var.alarm_low, "threshold")}"
  metric_name         = "ScaleStatus"
  namespace           = "Curalate/AutoScaling"

  dimensions {
    ClusterName = "${var.cluster_name}"
  }

  alarm_description = "Low cluster resource usage"
  alarm_actions     = ["${aws_autoscaling_policy.scale_down_blue.arn}"]
}

variable "alarm_high" {
  type = "map"

  default = {
    comparison_operator = "GreaterThanThreshold"
    evaluation_periods  = 4
    period              = 60
    statistic           = "Maximum"
    threshold           = 1
  }
}

variable "alarm_low" {
  type = "map"

  default = {
    comparison_operator = "LessThanThreshold"
    evaluation_periods  = 10
    period              = 60
    statistic           = "Maximum"
    threshold           = 1
  }
}
We made our Lambda dynamically configurable by loading data from our configuration system and allowing us to onboard new clusters to monitor, and to dynamically tune the values of the thresholds.
You can see this in effect here:
Host draining and ECS rescheduling
This leads us to another problem. When the ASG goes to down-scale from a CloudWatch event, it puts the boxes into DRAINING. However, draining doesn’t necessarily mean that existing services have been re-scheduled on other boxes! It just means that connections are drained from the existing hosts, and that the ECS scheduler now needs to move the containers elsewhere. This can be problematic in that if you are down-scaling 2 hosts that are serving both of your HA containers, then you can now have a situation where your service is at 0 instances! To solve this, we wired up a custom ASG lifecycle hook that polls the draining machines and makes sure that the containers are fully stopped, and that the active cluster contains at least the min running instances of each service (where a service defines its minimum acceptable threshold and its min allowed running instances). For example if a service can run at 50% capacity and its min is set to 20, then we need to verify that there are at least 10 active before we fully allow the box to be removed, giving the ECS scheduler time to move things around.
Cluster upgrades
Solving cluster scaling and draining just introduced the next question: how do we do zero downtime cluster upgrades? Because we now have many services running on the cluster, the blast radius for failure is much higher. If we fail a cluster upgrade we could take many of the services at Curalate down with us.
Our solution, while not fully automated, is beautiful in its simplicity. Leveraging the draining Lambda, we keep all our clusters grouped into ASGs labeled blue and green. To upgrade, we spin up the unused cluster with new backing AMI’s and wait for it to be steady state. Then we tear down the old cluster and rely on the draining Lambda to prevent any race issues with the ECS scheduler.
Each time we need to do a cluster upgrade, either for security updates, base AMI changes, or other infrastructure wide sweeping changes, we do a manual toggle using Terraform to drive the base changes.
For example, our Terraform ECS cluster module in QA looks like this
module "ecs_cluster_default_bg" {
  source = "github.com/curalate/infra-modules.git//aws-ecs-cluster-blue-green?ref=2018.03.07.20.09.12"

  cluster_name                       = "${aws_ecs_cluster.default.name}"
  availability_zones                 = "${data.terraform_remote_state.remote_env_state.availability_zones}"
  environment                        = "${var.environment}"
  region                             = "${var.region}"
  iam_instance_profile               = "${data.terraform_remote_state.remote_env_state.iam_instance_profile}"
  key_name                           = "${data.terraform_remote_state.remote_env_state.key_name}"
  security_group_ids                 = "${data.terraform_remote_state.remote_env_state.ecs_security_groups}"
  subnet_ids                         = "${data.terraform_remote_state.remote_env_state.public_subnet_ids}"
  drain_hook_notification_target_arn = "${module.drain_hook.notification_target_arn}"
  drain_hook_role_arn                = "${module.drain_hook.role_arn}"
  autoscale_enabled                  = true

  root_volume_size = 50
  team             = "devops"

  blue = {
    image_id      = "ami-5ac76b27"
    instance_type = "c4.2xlarge"

    min_size         = 2
    max_size         = 15
    desired_capacity = 5
  }

  green = {
    image_id      = "ami-c868b6b5"
    instance_type = "c3.2xlarge"

    min_size         = 0
    max_size         = 0
    desired_capacity = 0
  }
}
Monitoring with statsd
Curalate uses Datadog as our graph visualization tool and we send metrics to datadog via the dogstatsd agent that is installed on our boxes. Applications emit UDP events to the dogstatsd agent which then aggregates and sends messages to datadog over TCP.
In the containerized world we had 3 options for sending metrics
- Send directly from the app
- Deploy all containers with a sidecar of statsd
- Proxy messages to the host box and leave dogstatsd on the host
We elected for option 3 since option 1 makes it difficult to do sweeping upgrades and option 2 uses extra resources on ECS we didn’t want.
However we needed a way to determistically write messages from a Docker container to its host. To do this we leveraged the docker0 bridge network
# returns x.x.x.1 base ip of the docker0 bridge IP
get_data_dog_host(){
    # extracts the ip address from eth0 of 1.2.3.4 and splits off the last octet (returning 1.2.3)
    BASE_IP=`ifconfig | grep eth0 -A 1 | grep inet | awk '{print $2}' | sed "s/addr://" | cut -d. -f1-3`

    echo "${BASE_IP}.1"
}
And we configure our apps to use this IP to send messages to.
Cleanup
One thing we chose to do was to volume mount our log folders to the host system for semi-archival reasons. By mounting our application logs to the host, if the container crashed or was removed from Docker, we’d still have a record of what happened.
That said, containers are transient; they come and go all the time. The first question we had was “where do logs go?”. What folder do we mount them to? For us, we chose to mount all container logs in the following schema:
/var/log/curalate/<service-name>/containers/<constainer-sha>
This way we can back correlate the logs for a particular container in a particular folder. If we have multiple instances of the same image running a host the logs don’t stomp on each other.
We normally have a log rotator on our AMI boxes that handles long running log files, however in our AMI based deployments machines and clusters are immutable and singular. This means that as we do new deploys the old logs are removed with the box and only one service is allowed to sit on one EC2 host.
In the new world the infrastructure is immutable at the container level, not the VM level. So in this sense, the base VM also has a log rotator to rotate all the container logs, but we didn’t account for the fact that services will start and stop and deploy hundreds of times daily leaving hundreds of rotated log files in stale folders.
After the first disk alert though we added the following cron script:
buntu@ip-172-17-50-242:~$ crontab -l
# Chef Name: container-log-prune
*/10 * * * * /opt/curalate/docker/prune.rb
# Chef Name: volume-and-image-prune
0 0 * * * docker images -q | xargs docker rmi && docker system prune -f
We have 2 things happening here, the first is a Ruby script that checks for running containers and then deletes all container IDs in the recursive log glob that aren’t active anymore. We run this once an hour.
#!/usr/bin/env ruby

require 'set'
require 'fileutils'
require 'English'

containers = `docker ps --format ''`.split("\n").to_set

unless $CHILD_STATUS.success?
  puts 'Failed to query docker'
  exit 1
end

dirs = Dir.glob('/var/log/**/containers/*')

to_delete = dirs.reject do |d|
  (containers.include? File.basename(d))
end

to_delete.each do |d|
  puts "Deleting #{d}"

  FileUtils.rm_rf d
end
The second script is pretty straightforward and we leverage the Docker system prune command to remove old volume overlay data, images that are unused, and any other system cleanup stuff. We run this daily because we want to leverage the existing images that are already downloaded on a box to speed up autoscaling. We’re ok with taking a once daily hit to download the image base layers at midnight if necessary during a scaling event.
JMXMP
JMX is a critical tool in our toolbox here at Curalate as nearly all of our services and applications are written using Scala on the JVM. Normally in our AMI deployments we can singularly control the ports that are open and they are determistic. If we open port 5555 it’s always open on that box. However when we start to have many services run on the same host, we need to leverage dockers dynamic port routing which makes knowing which port maps to what more difficult.
Normally this isn’t really an issue, as services that do need to expose ports to either each other or the public are routed through an ALB that manages that for us. But JMX is a different beast. JMX, in its ultimate wisdom, requires a 2 port handshake in order to connect. What this means is that the port you connect to on JMX is not the ultimate port you communicate over in JMX. When you make a JMX connection to the connection port it replies back with the communication port and you then communicate on that.
But in the world of dynamic port mappings, we can find the first port from the dynamic mapping, but there is no way for us to know the second port. This is because the container itself has no information about what its port mapping is, for all it knows its port is what it says it is!
Thankfully there is a solution using an extension to JMX called JMXMP. With some research from this blog post we rolled a jmxmp java agent:
package com.curalate.agents.jmxmp;

import javax.management.MBeanServer;
import javax.management.remote.JMXConnectorServer;
import javax.management.remote.JMXConnectorServerFactory;
import javax.management.remote.JMXServiceURL;
import java.lang.instrument.Instrumentation;
import java.lang.management.ManagementFactory;
import java.net.Inet4Address;
import java.net.InetAddress;
import java.net.NetworkInterface;
import java.net.UnknownHostException;
import java.util.Collections;
import java.util.HashMap;
import java.util.Map;

public class Agent {
    public static void premain(String agentArgs, Instrumentation inst) {
        Boolean enableLogging = Boolean.valueOf(System.getProperty("javax.management.remote.jmx.enable_logging", "false"));

        Boolean bindEth0 = Boolean.valueOf(System.getProperty("javax.management.remote.jmx.bind_eth0", "true"));

        try {
            Map<String, String> jmxEnvironment = new HashMap<String, String>();

            jmxEnvironment.put("jmx.remote.server.address.wildcard", "false");

            final String defaultHostAddress = (bindEth0 ? getEth0() : getLocalHost()).replace("/","");

            JMXServiceURL jmxUrl = new JMXServiceURL(System.getProperty("javax.management.remote.jmxmp.url", "service:jmx:jmxmp://" + defaultHostAddress + ":5555"));

            MBeanServer mbs = ManagementFactory.getPlatformMBeanServer();

            JMXConnectorServer jmxRemoteServer = JMXConnectorServerFactory.newJMXConnectorServer(jmxUrl, jmxEnvironment, mbs);

            if (enableLogging) {
                System.out.println("Starting jmxmp agent on '" + jmxUrl + "'");
            }

            jmxRemoteServer.start();
        }
        catch (Throwable e) {
            if (enableLogging) {
                e.printStackTrace();
            }
        }
    }

    private static String getEth0() {
        try {
            return Collections.list(NetworkInterface.getByName("eth0").getInetAddresses())
                              .stream()
                              .filter(x -> !x.isLoopbackAddress() && x instanceof Inet4Address)
                              .findFirst()
                              .map(Object::toString)
                              .orElse("127.0.0.1");
        }
        catch (Exception e) {
            return "127.0.0.1";
        }
    }

    private static String getLocalHost() {
        try {
            return InetAddress.getLocalHost().getHostName();
        }
        catch (UnknownHostException e) {
            return "127.0.0.1";
        }
    }
}
That we bundle in all our service startups:
exec java -agentpath:/usr/local/lib/libheapster.so -javaagent:agents/jmxmp-agent.jar $JVM_OPTS $JVM_ARGS -jar
JMXMP does basically the same thing as JMX, except it only requires one port to be open. By standardizing our ports on port 5555 we can look up the 5555 port mapping in ECS and connect to it via JMXMP and get all our “favorite” JMX goodies (if you’re doing JMX you’re already in a bad place).
For full reference all our dockerized java apps have a main entrypoint that Docker executes which is shown below. This allows us some sane default JVM settings but also exposes a way for us to manually override any of the settings via the JVM_ARGS env var (which we can set during our Terraform deployments)
#!/usr/bin/env bash

HOST_IP="localhost"

# Entrypoint for service start
main() {
    set_host_ip

    DATADOG_HOST=`get_data_dog_host`

    # location the fat jar
    BIN_JAR=`ls /app/bin/*.jar | head`

    LOG_PATH="/var/log/${HOSTNAME}"

    mkdir -p ${LOG_PATH}
    mkdir -p /heap_dumps

    JVM_OPTS="""
        -server \
        -XX:+HeapDumpOnOutOfMemoryError -XX:HeapDumpPath=/heap_dumps \
        -XX:+UseConcMarkSweepGC -XX:+CMSParallelRemarkEnabled \
        -Xmx512m -Xms512m \
        -XX:+ScavengeBeforeFullGC -XX:+CMSScavengeBeforeRemark \
        -Dsun.net.inetaddr.ttl=5 \
        -Dcom.sun.management.jmxremote.port=1045 \
        -Dcom.sun.management.jmxremote.authenticate=false \
        -Dcom.sun.management.jmxremote.ssl=false \
        -Dcontainer.id=${HOSTNAME} \
        -Dhostname=${HOST_IP} \
        -Dlog.service.output=${LOG_PATH}/service.log \
        -Dlog.access.output=${LOG_PATH}/access.log \
        -Dloggly.enabled=${LOGGLY_ENABLED} \
        -Ddatadog.host=${DATADOG_HOST} \
        -Ddatadog.defaultTags=application:${CLOUD_APP}
    """

    exec java -agentpath:/usr/local/lib/libheapster.so -javaagent:agents/jmxmp-agent.jar $JVM_OPTS $JVM_ARGS -jar ${BIN_JAR} $@
}

# Set the host IP variable of the EC2 host instance
# by querying the EC2 metadata api
# if there is no response after the timeout we'll default to localhost
set_host_ip () {
    if [ "200" == "$(/usr/bin/curl --connect-timeout 2 --max-time 2 -s -o /dev/null -w "%{http_code}" 169.254.169.254/latest/meta-data/local-ipv4)" ]
    then
        HOST_IP=$(curl 169.254.169.254/latest/meta-data/local-ipv4)
    else
        HOST_IP="$(hostname)"

        if [ "${HOST_IP}" = "${HOSTNAME}" ]
        then
            HOST_IP="localhost"
        fi
    fi
}

# returns x.x.x.1 base ip of the docker0 bridge IP
get_data_dog_host(){
    # extracts the ip address from eth0 of 1.2.3.4 and splits off the last octet (returning 1.2.3)
    BASE_IP=`ifconfig | grep eth0 -A 1 | grep inet | awk '{print $2}' | sed "s/addr://" | cut -d. -f1-3`

    echo "${BASE_IP}.1"
}

# execute main
main $@
Choosing how to group a cluster
One thing we wrestled with is how to choose where a service will go. For the most part we have a default cluster comprised of c4.2xl’s that everyone is allowed to deploy to.
I wanted to call out that choosing what service goes on what cluster and what machine types comprise a cluster can be tricky. For our GPU based services, the choice is obvious in that they go onto a cluster that has GPU acceleration. For other clusters we tried smaller machines with fewer containers, and we tried larger machines with more containers. We found that we preferred fewer larger machines since most of our services are not running at full capacity, so they get the benefit of extra IO and memory without overloading the host system. With smaller boxes we had less headroom and it was more difficult to pack services with varying degrees of memory/CPU reservation necessities.
On that note however, we’ve also chosen to segment some high priority applications onto their own clusters. These are services that under no circumstances can fail, or require more than average resources (whether IO or otherwise), or are particularly unstable. While we don’t get the cost savings by binpacking services onto that cluster, we still get the fast deploy/rollback/scaling properties with containers so we still consider it a net win.
Conclusion
ECS was really easy to get started on, but as with any production system there are always gotcha’s. Overall we’re really pleased with the experience, even though it wasn’t pain free. In the end, we can now deploy in seconds, rollback in seconds, and still enjoy a pseudo immutable infrastructure that is simple to reason about as well as locally reproducible!

Anton Kropp was a Software Engineer at Curalate.