Tracing High Volume Services ¬
We like to think that building a service ecosystem is like stacking building blocks. You start with a function in your code. That function is hosted in a class. That class in a service. That service is hosted in a cluster. That cluster in a region. That region in a data center, etc. At each level there’s a myriad of challenges.
From the start, developers tend to use things like logging and metrics to debug their systems, but a certain class of problems crops up when you need to debug across services. From a debugging perspective, you’d like to have a higher projection of the view of the system: a linearized view of what requests are doing. I.e. You want to be able to see that service A called service B and service C called service D at the granularity of single requests.
Cross Service Logging
The simplest solution to this is to require that every call from service to service comes with some sort of trace identifier. Incoming requests into the system, either from public API’s or client side requests, or even from async daemon invoked timers/schedules/etc generates a trace. This trace then gets propagated through the entire system. If you use this trace in all your log statements you can now correlate cross service calls.
How is this accomplished at Curalate? For the most part we use Finagle based services and the Twitter ecosystem has done a good job of providing the concept of a thread local TraceId and automatically propagating it to all other twitter-* components (yet another reason we like Finatra!).
All of our service clients automatically pull this thread local trace id out and populate a known HTTP header field that services then pick up and re-assume. For Finagle based clients this is auto-magick’d for you. For other clients that we use, like OkHttp, we had to add custom interceptors that pulled the trace from the thread local and set it on the request.
Here is an example of the header being sent automatically as part of Zipkin based headers (which we re-use as our internal trace identifiers):
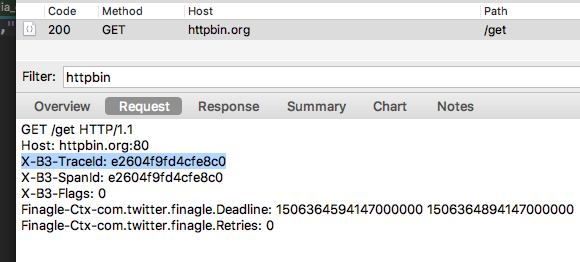
Notice the X-B3-TraceId header. When a service receives this request it’ll re-assume the trace id and set its SLF4j MDC field of traceId to be that value. We can now include in our logback.xml configuration to include the trace id like in our STDOUT log configuration below:
<appender name="STDOUT-COLOR" class="ch.qos.logback.core.ConsoleAppender">
    <filter class="ch.qos.logback.classic.filter.ThresholdFilter">
        <level>TRACE</level>
    </filter>
    <encoder>
        <pattern>%yellow(%d) [%magenta(%X{traceId})] [%thread] %highlight(%-5level) %cyan(%logger{36}) %marker - %msg%n</pattern>
    </encoder>
</appender>
And we can also send the trace id as a structured JSON field to Loggly.
Let’s look at an example from our own logs:

What we’re seeing here is a system called media-api made a query to a system called networkinformationsvc. The underlying request carried a correlating trace id across the service boundaries and both systems logged to Loggly with the json.tid (transaction id) field populated. Now we can query our logs and get a linear time based view of what’s happening.
Thread local tracing
The trick here is to make sure that this implicit trace id that is pinned to the thread local of the initiating request properly moves from thread to thread as you make async calls. We don’t want anyone to have to ever remember to set the trace. It should just gracefully flow from thread to thread implicity.
To make sure that traces hop properly between systems we had to make sure to enforce that everybody uses an ExecutionContext that safely captures the callers thread local’s before executing. This is critical, otherwise you can make an async call and the trace id gets dropped. In that case, bye bye go the logs! It’s hyper important to always take an execution context and to never pin an execution context when it comes to async scala code. Thankfully, we can make any execution context safe by wrapping it up in a delegate:
/**
 * Wrapper around an existing ExecutionContext that makes it propagate MDC information.
 */
class PropagatingExecutionContextWrapper(wrapped: ExecutionContext)
  extends ExecutionContext { self =>

   override def prepare(): ExecutionContext = new ExecutionContext {
     // Save the call-site state
     private val context = Local.save()

     def execute(r: Runnable): Unit = self.execute(new Runnable {
       def run(): Unit = {
         // re-assume the captured call site thread locals
         Local.let(context) {
           r.run()
         }
       }
     })

     def reportFailure(t: Throwable): Unit = self.reportFailure(t)
   }

  override def execute(r: Runnable): Unit = wrapped.execute(r)

  override def reportFailure(t: Throwable): Unit = wrapped.reportFailure(t)
}

class TwitterExecutionContextProvider extends ExecutionContextProvider {
  /**
   * Safely wrap any execution context into one that properly passes context
   *
   * @param executionContext
   * @return
   */
  override def of(executionContext: ExecutionContext) = new PropagatingExecutionContextWrapper(executionContext)
}
We’ve taken this trace wrapping concept and applied to all kinds of executors like ExecutorService, and ScheduledExecutorService. Technically we don’t really want to expose the internals of how we wrap traces, so we load an ExecutionContextProvider via a java service loading mechanism and provide an API contract so that people can wrap executors without caring how they are wrapped:
/**
 * A provider that loads from the java service mechanism
 */
object ExecutionContextProvider {
  lazy val provider: ExecutionContextProvider = {
    Option(ServiceLoader.load(classOf[ExecutionContextProvider])).
      map(_.asScala).
      getOrElse(Nil).
      headOption.
      getOrElse(throw new MissingExecutionContextException)
  }
}

/**
 * Marker interfaces to provide contexts with custom logic. This
 * forces users to make sure to use the execution context providers that support request tracing
 * and maybe other tooling
 */
trait ProvidedExecutionContext extends ExecutionContext

/**
 * A context provider contract
 */
trait ExecutionContextProvider {
  def of(context: ExecutionContext): ProvidedExecutionContext

  ...
}
From a callers perspective they now do:
implicit val execContext = ExecutionContextProvider.provider.of(scala.concurrent.ExecutionContext.Implicits.global)
Which would wrap, in this example, the default scala context.
Service to Service dependency and performance tracing
Well that’s great! We have a way to safely and easily pass trace id’s, and we’ve tooled through our clients to all pass this trace id automatically, but this only gives us logging information. We’d really like to be able to leverage the trace information to get more interesting statistics such as service to service dependencies, performance across service hops, etc. Correlated logs is just the beginning of what we can do.
Zipkin is an open source tool that we’ve discussed here before so we won’t go too much into it, but needless to say that Zipkin hinges on us having proper trace identifiers. It samples incoming requests to determine IF things should be traced or not (i.e. sent to Zipkin). By default, we have all our services send 0.1% of their requests to Zipkin to minimize impact on the service.
Let’s look at an example:
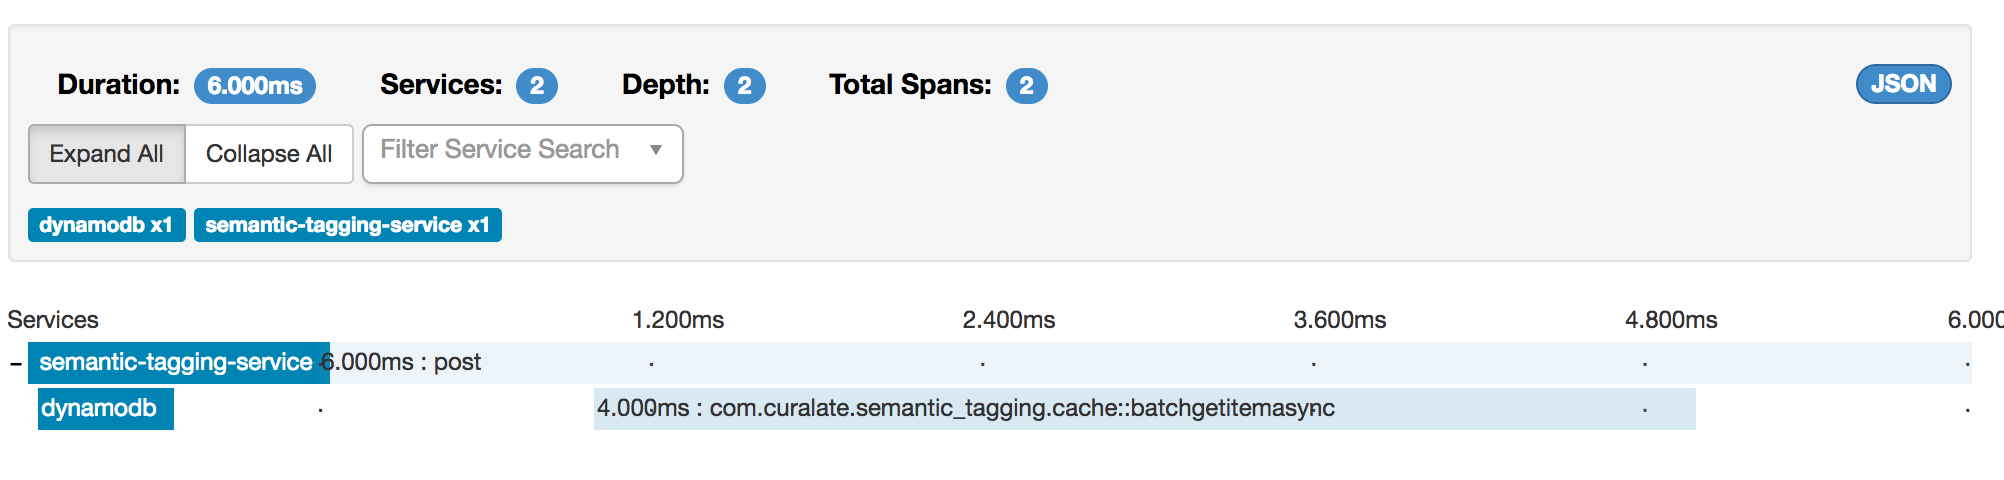
In this Zipkin trace we can see that this batch call made a call to Dynamo. The whole call took 6 milliseconds and 4 of those milliseconds were spent calling Dynamo. We’ve tooled through all our external client dependencies with Zipkin trace information automatically using java dynamic proxies so that as we upgrade our external dep’s we get tracing on new functions as well.
If we dig further into the trace:
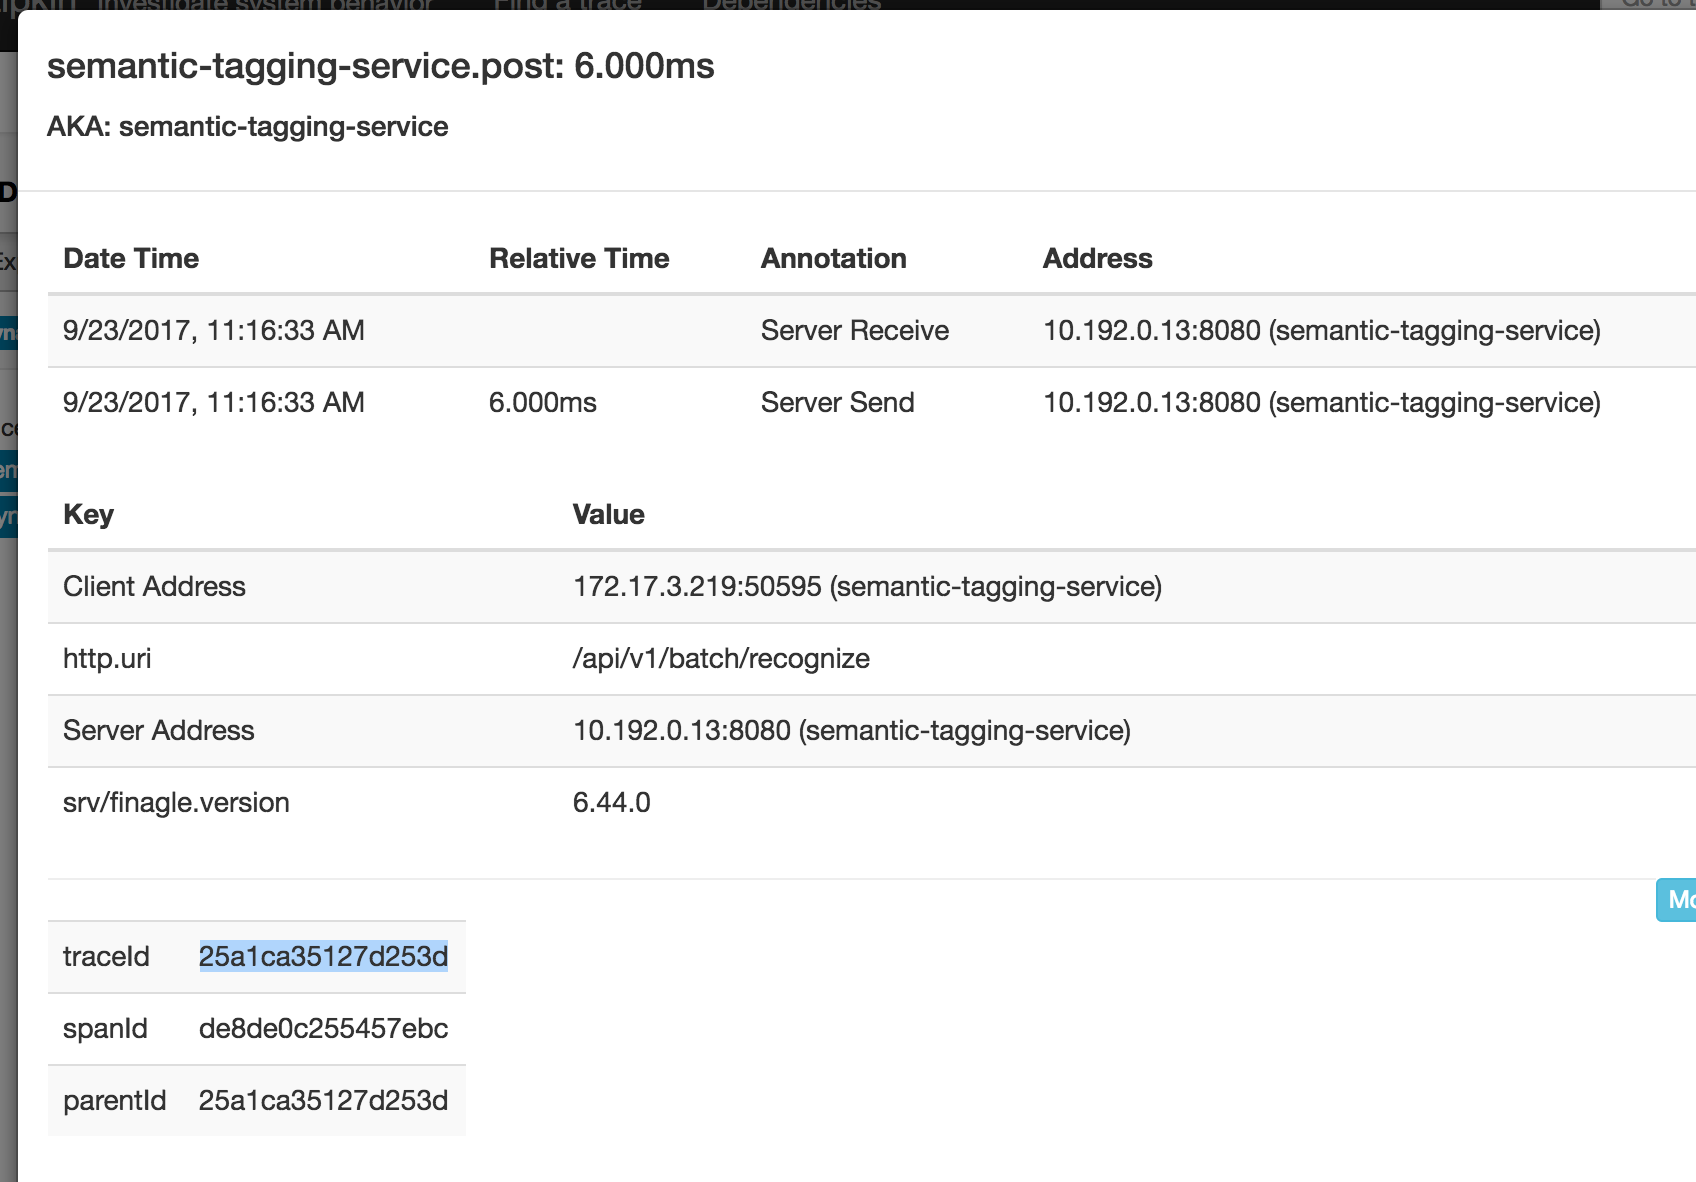
We can now see (highlighted) the trace ID and search in our logs for logs related to this trace
Finding needles in the haystack
We have a way to correlate logs, and get sampled performance and dependency information between services via Zipkin. What we still can’t do yet is trace an individual piece of data flowing through high volume queues and streams.
Some of our services at Curalate process 5 to 10 thousand items a second. It’s just not fiscally prudent to log all that information to Loggly or emit unique metrics to our metrics system (DataDog). Still, we want to know at the event level where things are in the system, where they passed through, where they got dropped etc. We want to answer the question of
Where is identifier XYZ.123 in the system and where did it go and come from?
This is difficult to answer with the current tools we’ve discussed.

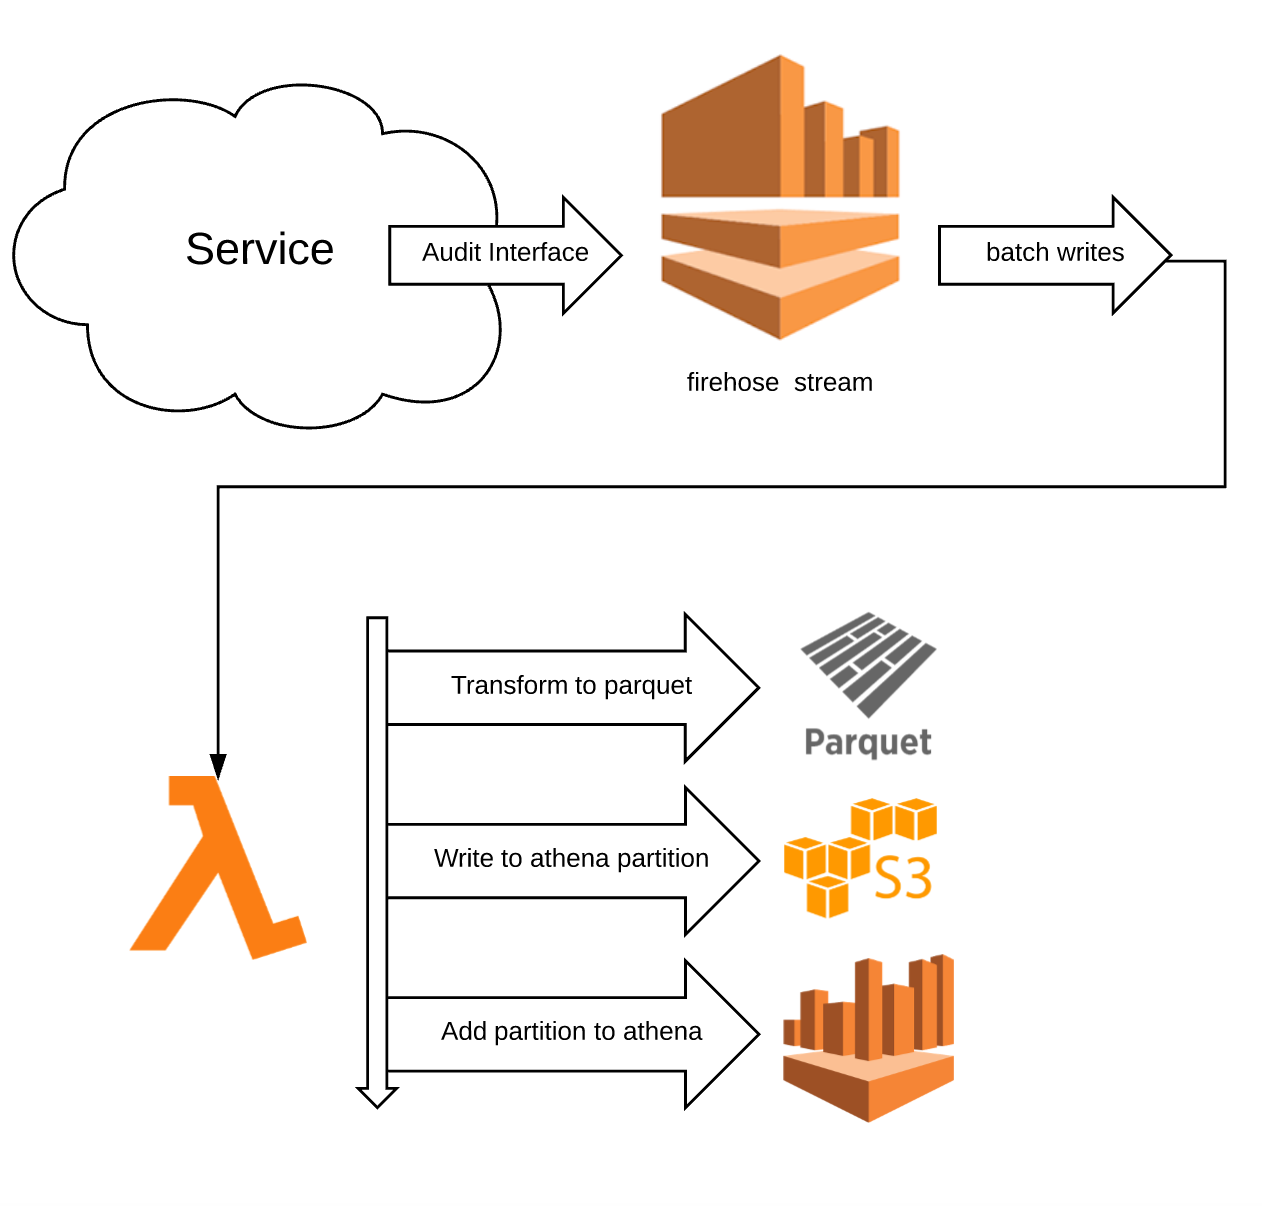
To solve this problem we have one more system in play. This is our high volume auditing system that lets us write and filter audit events at a large scale (100k req/s+). The basic architecture here is we have services write audit events via an Audit API which are funneled to Kinesis Firehose. The firehose stream buffers data for either 5 minutes or 128 MB (whichever comes first). When the buffer limit is reached, firehose dumps newline separated JSON in a flat fi`le into S3. We have a lambda function that waits for S3 create events on the bucket, reads the JSON, then transforms the JSON events into Parquet which is an efficient columnar storage format. The Parquet file is written back into S3 into a new folder with the naming scheme of
year=YYYY/month=MM/day=DD/hour=HH/minute=mm/<uuid>.parquet
Where the minutes are grouped in 5 minute intervals. This partition is then added to Athena, which is a managed map-reduce around PrestoDB, that lets you query large datasets in S3.
What does this have to do with trace id’s? Each event emitted comes with a trace id that we can use to query back to logs or Zipkin or other correlating identifiers. This means that even if services aren’t logging to Loggly due to volume restrictions, we can still see how events trace through the system. Let’s look at an example where we find a specific network identifier from Instagram and see when it was data mined and when we added semantic image tags to it (via our vision APIs):
SELECT minute, app, message, timestamp, context
FROM curalateauditevents."audit_events"
WHERE context['network_id'] = '1584258444344170009_249075471' and context['network']='instagram'
and day=18 and hour=22
order by timestamp desc
limit 100
This is the Athena query. We’ve included the specific network ID and network we are looking for, as well as a limited partition scope.
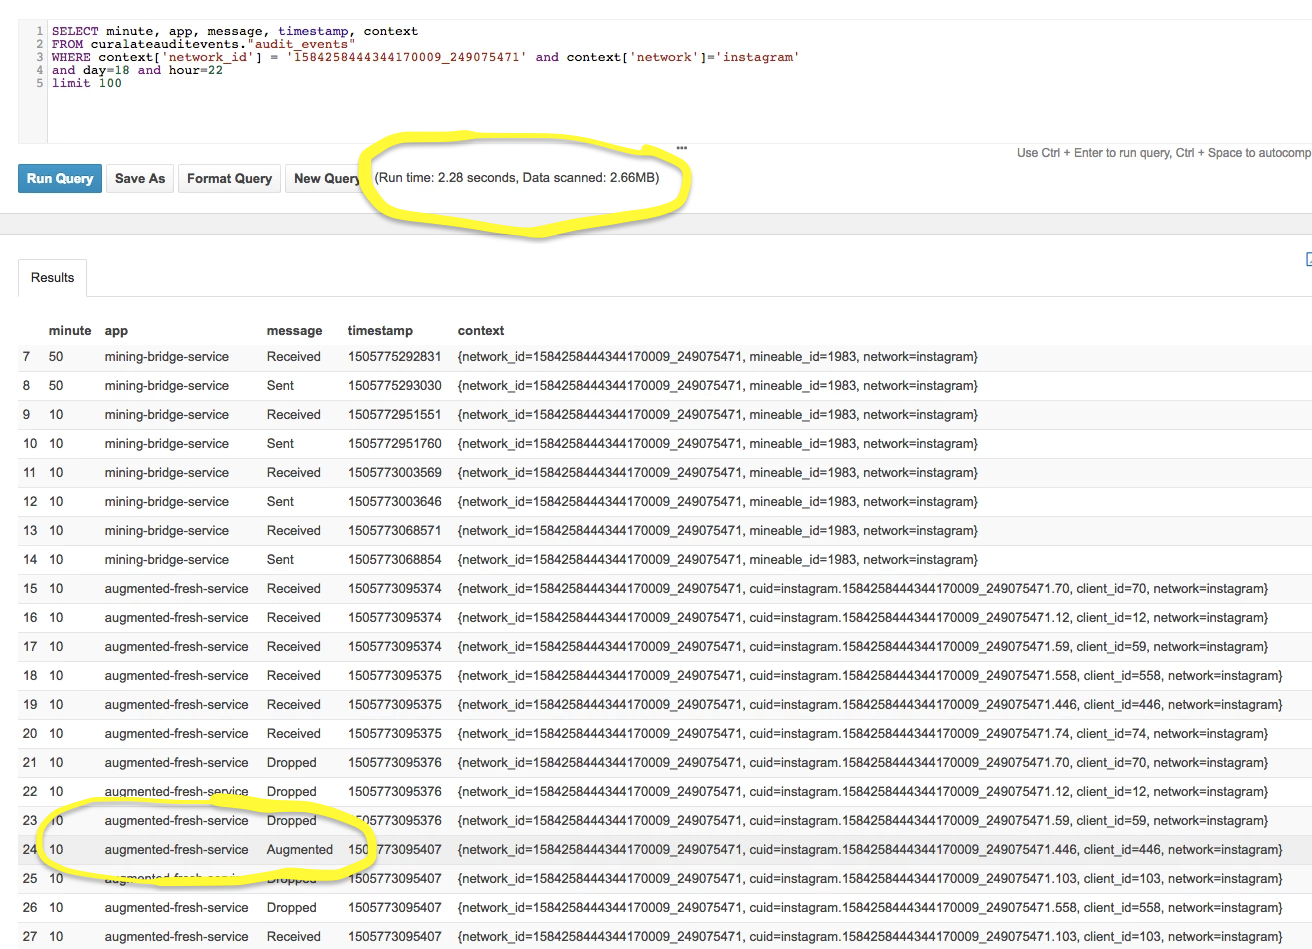
Notice the two highlights.
Starting at the second highlight there is a message that we augmented the piece of data. In our particular pipe we only augment data under specific circumstances (not every image is analyzed) and so it was important to see that some images were dropped and this one was augmented. Now we can definitely say “yes, item ABC was augmented but item DEF was not and here is why”. Awesome.
Moving upwards, the first highlight is how much data was scanned. This particular partition we looked through has 100MB of data, but we only searched through 2MB to find what we wanted (this is due to the optimization of Parquet). Athena is priced by how much data you scan at a cost of $5 per terabyte. So this query was pretty much free at a cost of $0.000004. The total set of files across all the partitions for the past week is roughly 21GB spanning about 3.5B records. So even if we queried all the data, we’d only pay $.04. In fact, the biggest cost here isn’t in storage or query or lambda, it’s in firehose! Firehose charges you $0.029 per GB transferred. At this rate we pay 60 cents a week. The boss is going to be ok with that.
However, there are still some issues here. Remember the target scale is upwards of 100k req/s. At that scale we’re dealing with a LOT of data through Kinesis Firehose. That’s a lot of data into S3, a lot of IO reads to transform to Parquet, and a lot of opportunities to accidentally scan through tons of data in our athena partitions with poorly written queries that loop over repeated data (even though we limit partitions to a 2 week TTL). We also now have issues of rate limiting with Kinesis Firehose.
On top of that, some services just pump so much repeated data that its not worth seeing it all the time. To that end we need some sort of way to do live filters on the streams. What we’ve done to solve this problem is leverage dynamically invoked Nashorn javascript filters. We load up filters from a known remote location at an interval of 30 seconds, and if a service is marked for filtering (i.e. it has a really high load and needs to be filtered) then it’ll run all of its audit events through the filter before it actually gets sent to the downstream firehose. If an event fails the filter it’s discarded. If it passes, the event is annotated with which filter name it passed through and sent through the stream.
Filters are just YML files for us:
name: "Filter name"
expiration: <Optional DateTime. Epoch or string datetime of ISO formats parseable by JODA>
js: |
    function filter(event) {
        // javascript that returns a boolean
    }
And an example filter may look like
name: "anton_client_filter"
js: |
    function filter(event) {
      var client = event.context.get("client_id")

      return client != null && client == "3136"
    }
In this filter only events that are marked with the client id of my client will pass through. Some systems don’t need to be filtered so all their events pass through anyway.
Now we can write queries like
SELECT minute, app, message, timestamp, context
FROM curalateauditevents."audit_events"
WHERE contains(trace_names, 'anton_client_filter')
and day=18 and hour=22
limit 100
To get events that were tagged with my filter in the current partition. From there, we now can do other exploratory queries to find related data (either by trace id or by other identifiers related to the data we care about).
Let’s look at some graphs that show how dramatic this filtering can be
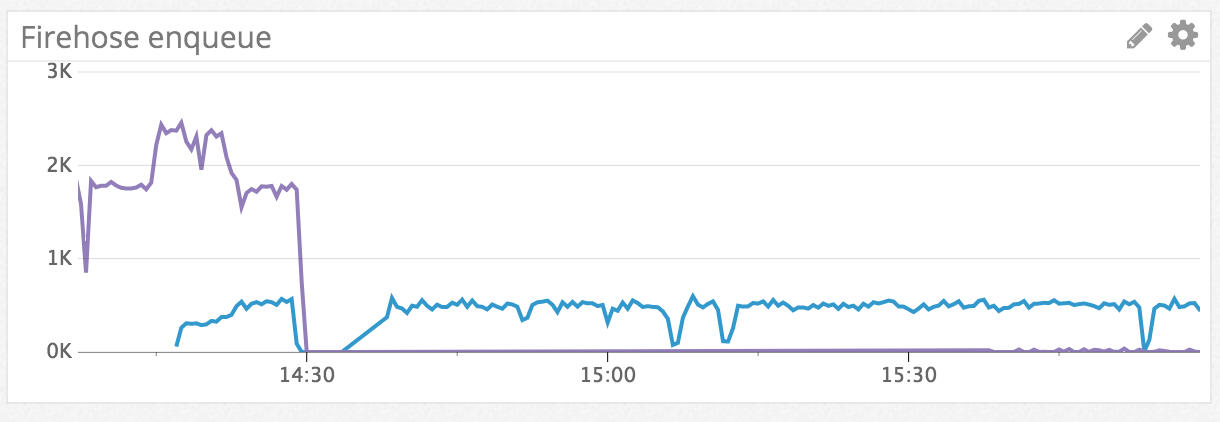
Here the purple line is one of our data mining ingestion endpoints. It’s pumping a lot of data to firehose, most of which is repeated over time and so isn’t super useful to get all the input from. The moment the graph drops is when the yml file was uploaded with a filter to add filtering to the service. The blue line is a downstream service that gets data after debouncing and other processing. Given its load is a lot less we don’t care so much that it is sending all its data downstream. You can see the purple line slow to a trickle later on when the filter kicks in and data starts matching it.
Caveats with Nashorn
Building the system out there were a few interesting caveats when using Nashorn in a high volume pipeline like this.
The first was that subtle differences in javascript can have massive performance impacts. Let’s look at some examples and benchmark them.
function filter(event) {
  var anton = {
    "136742": true,
    "153353": true
  }

  var mineable = event.context.get("mineable_id")

  return mineable != null && anton[mineable]
}
The JMH benchmarks of running this code is
[info] FiltersBenchmark.testInvoke  thrpt   20     1027.409 ±      29.922  ops/s
[info] FiltersBenchmark.testInvoke   avgt   20  1484234.075 ± 1783689.007  ns/op
What?? 29 ops/second

Let’s make some adjustments to the filter, given our internal system loads the javascript into an isolated scope per filter and then re-invokes just the function filter each time (letting us safely create global objects and pay heavy prices for things once):
var anton = {
  "136742": true,
  "153353": true
}

function filter(event) {
  var mineable = event.context.get("mineable_id")

  return mineable != null && anton[mineable]
}
[info] FiltersBenchmark.testInvoke  thrpt   20  7391161.402 ± 206020.703  ops/s
[info] FiltersBenchmark.testInvoke   avgt   20    14879.890 ±   8087.179  ns/op
Ah, much better! 206k ops/sec.

If we use java constructs:
function filter(event) {
  var anton = new java.util.HashSet();
  anton.add("136742")
  anton.add("153353")

  var mineable = event.context.get("mineable_id")

  return mineable != null && anton.contains(mineable)
}
[info] FiltersBenchmark.testInvoke  thrpt   20  5662799.317 ± 301113.837  ops/s
[info] FiltersBenchmark.testInvoke   avgt   20    41963.710 ±  11349.277  ns/op
Even better! 301k ops/sec
Something is clearly up with the anonymous object creation in Nashorn. Needless to say, benchmarking is important, especially when these filters are going to be dynamically injected into every single service we have. We need them to be performant, sandboxed, and safe to fail.
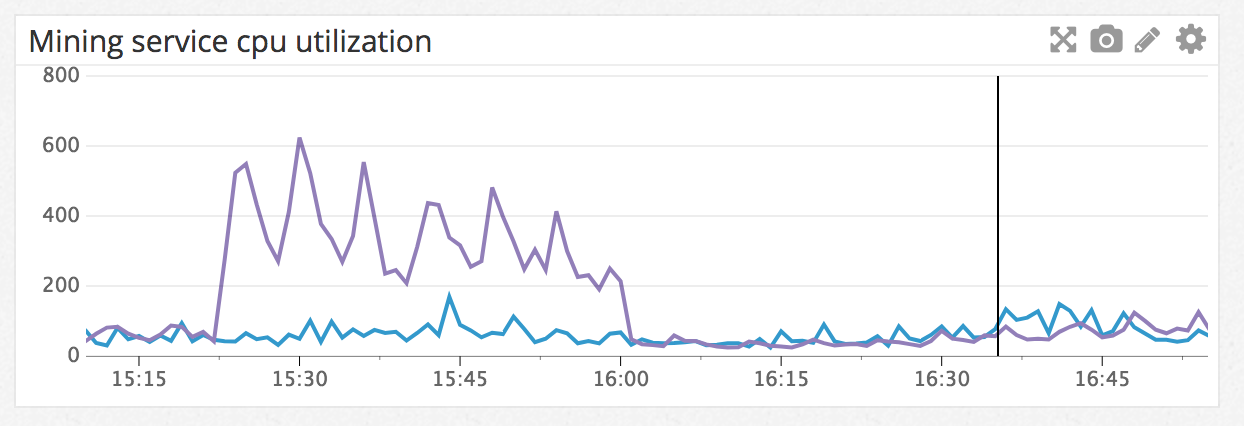
For that we make sure everything runs its own engine scope in a separate execution context isolated from main running code and is fired off asynchronously to not block the main calling thread. This is also where we have monitoring and alerting on when someone uploads a non-performant filter so we can investigate and mitigate quickly.
For example, the discovery of the poorly performing json object came from this alert:
Conclusion
Tracing is hard and it’s incredibly difficult to tool through after the fact if you start to build service architectures without this in mind from the get go. Tooling trace identifiers through the system from the beginning sets you up for success in building more interesting debugging infrastructure that isn’t always possible without that. When building larger service ecosystems it’s important to keep in mind how to inspect things at varying granularity levels. Sometimes building custom tools to help inspect the systems is worth the effort, especially if they help debug complicated escalations or data inconsistencies.

Anton Kropp was a Software Engineer at Curalate.