Hey, you busy? I have thousands of questions to ask you. ¬
If you’re a brick-and-mortar business owner, you quickly identify patterns in your customer foot traffic, especially around the holidays when achieving your sales goals depends on both timely and quality service. If you’re an e-commerce business owner, like many of Curalate’s 1,000+ customers, it’s really no different: holiday sales are crucial to success and they depend heavily on your site’s reliability.
At Curalate, we take great pride in maintaining high availability and low latency for our client integrations throughout the year. But over the “Black Fiveday” period—Thanksgiving through Cyber Monday—and the week leading up to and including the day after Christmas, we see a roughly 5x increase in network requests to our APIs from our clients’ sites. Therefore it’s crucial that we both design our systems to handle that increased load and perform load testing on the systems ahead of time to prove that our designs work.
This post describes how we carried out load tests of our infrastructure to prepare for the holiday traffic increase on our APIs. Additionally, it highlights how our approach towards dynamic scalability reduces costs by avoiding over-provisioning.
Load Test Planning
Our first question was: what volume of traffic can we expect? To answer that, we consulted the last several years of data describing our holiday traffic load pattern. Second: what are the important dimensions of that traffic? For example, do we expect a majority of the traffic to be cached or uncached? Do total requests matter or only instantaneous load? Since a previous blog post discussed cached versus uncached testing, this post focuses on API request rate.
Total requests in a day is interesting, but only suggests an average requests-per-second (RPS) rate. The metric we’re mostly interested in is the daily peak RPS rate. This gives us an idea of the busiest moment in our day, and if we can handle that rate, we should have confidence that we can handle lesser request rates at other times.
Peak requests-per-second
Consulting our historical data, we observed that Black Fiveday typically has a daily peak RPS that is 5x higher than the normal peak rate during September of the same year. With this in mind, we calculated the 5x peak RPS rate from our September 2018 data, and then used some simple bash scripts (described in the next section) and other tools to steadily increase our API request load to the predicted maximum rate.
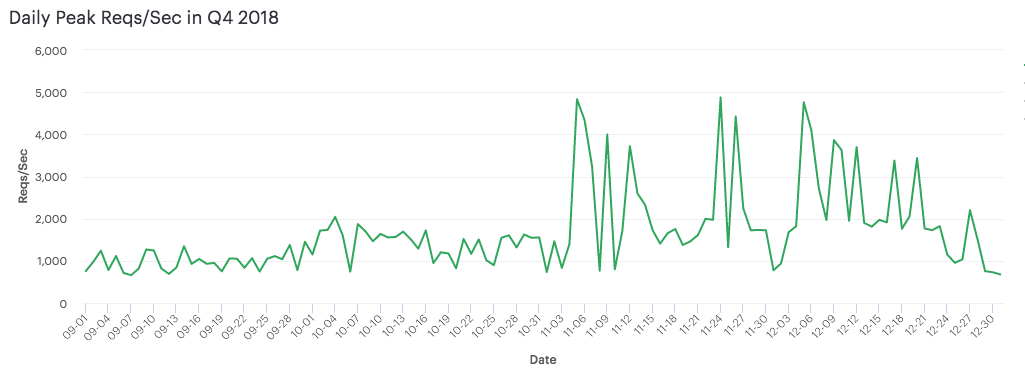
The below graph shows the Daily Peak RPS rate on our API over the course of the entire fourth quarter (September through December, 2018). November 5th shows the internal load generated using the script below targeting our expected 5x traffic increase. November 24th (Black Friday) and December 5th were our two highest peaks for publicly-generated traffic to our API by end-users.

So, how’d we do? Well, we were spot-on with our prediction! Next year we’re predicting winning lottery numbers 😉. In truth, we didn’t expect our prediction to be that close to the exact peak traffic load, and it’s a reasonable question to ask if we should have tested a little higher given the actual load. I can understand arguments on both sides.
Load Test Execution
Our 2017 holiday load testing blog post already shared details on the different load tests we performed (cached & uncached, various API endpoints, etc.), as well as some example output of the tool, so this post reproduces just one of those scripts here for context. To execute the actual load test, we once again used Vegeta this year, as we enjoyed our experience using it last year.
The following bash script shows how we use Vegeta to slowly increase the request rate to a specified API endpoint:
#!/bin/bash

#  File: load-test.sh
# usage: ./load-test.sh <api endpoint> <start rate> <rate step increment> <step duration> <max rate> <test tag>

if [ $# -ne 6 ]; then
  echo "usage: $0 <api endpoint> <start rate> <rate step increment> <step duration> <max rate> <test tag>"
  exit 1
fi

Target=$1
StartRate=$2
RateStep=$3
StepDuration=$4
MaxRate=$5
Tag=$6

CurrentRate=$StartRate

while [ $CurrentRate -le $MaxRate ]; do
  OutputFile="test-$Tag-$MaxRate-$CurrentRate.bin"
  if [ $CurrentRate -lt $MaxRate ]; then
    echo $Target | ./vegeta attack -rate=$CurrentRate -duration=$StepDuration > $OutputFile
  else
    echo $Target | ./vegeta attack -rate=$MaxRate > $OutputFile
  fi
  CurrentRate=$((CurrentRate+RateStep))
done
The above script will repeatedly execute Vegeta with an increasing request rate until it reaches the specified max rate. Each Vegeta execution will run for the specified duration and the final execution, with the maximum rate, will run until manually killed. Additionally, each execution will write a distinct Vegeta output file.
Elastic scaling example
Handling a 5x peak in your daily traffic load is great, and it’s really easy, right?
InstanceCount=$(echo "$InstanceCount * 5" | bc)
😛 Okay, so it’s really easy if you don’t care about your costs. For those of us who do care about costs, our goal is to dynamically scale up our computing resources as demand for our services increases, and then gracefully scale down our resources as demand wanes.
Dynamic Scaling
AWS obviously makes this very easy as long as you have things configured properly. While some of our legacy services still run as AMIs deployed within auto-scaling groups on EC2 instances, most of our microservices now run as containers on Amazon ECS. We wrote a blog post earlier this year detailing all the various aspects that come into play when running our production systems on ECS.
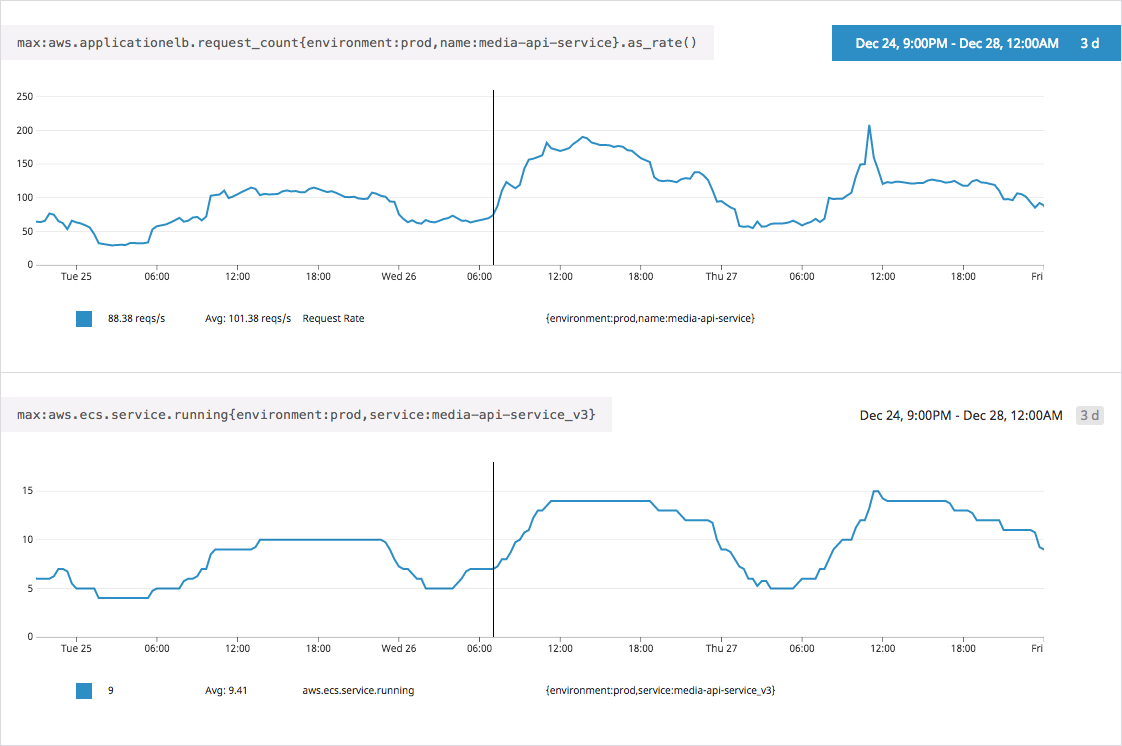
Since that post already explains how we run our systems on ECS, this post simply provides an example of that dynamic scaling in action. The graphs below show the request rate on one of our services called “Media API” (“media-api-service”) and the corresponding number of containers powering that service (“media-api-service_v3”) during the three day period from Christmas through December 27th.

As you can see, we were quick to add more containers to meet increased request demand, and efficient in removing them soon after the request rate dropped. While the bottom graph is not a direct representation of the underlying EC2 instances powering the ECS cluster, it’s a good estimate for how dynamic our EC2 capacity (and costs) would be if all services in the cluster employ a similar scaling approach.
Scaling metric
Speaking of scaling, what metric do we scale on? There are several options including CPU and memory utilization, as well as latency and queue size. In our experience, scaling on the CPU utilization works well enough for container-based services. When a given service’s containers have an average CPU utilization above some threshold, say, 75%, we add a new container and re-evaluate after some time. When CPU utilization drops below, say, 60%, we stop a container and re-evaluate after some time. We scale some of our services on memory utilization in the same way.
Discussion and related notes
For brevity and clarity, this post skipped over a few points related to various aspects above. Let me address a few lingering questions and relevant details that are worth noting but not central to the theme of this post.
- While total requests doesn’t directly describe peak requests-per-second, it can impact other resources sensitive to total data size such as event queues and logging/diagnostic data. Keep those types of resources in mind both when executing the load test and facing increased live traffic.
- We talked about scaling up compute resources to meet the increased server request rate, but if your traffic is bursty in the extreme (e.g., it goes from 1x to 10x or higher in a few seconds) then you should consider using a CDN rather than trying to dynamically scale to meet that load. A CDN introduces some delay in pushing out new data but it can withstand orders of magnitude higher request rates because the response is statically determined by the request input.
- Synthetic load tests on production infrastructure could impact live production traffic through dependent resources such as databases, caches and event queues. For example, if you run a “cache-missing” test on live infrastructure, you may end up evicting all of your real customers’ data and drastically reducing performance for your legitimate production traffic.
- The beginning of this post mentions the importance of reliability during the holiday period. To see how Curalate’s reliability compared to several of our competitors during Black Fiveday 2018, check out this blog post.
—
Hopefully this post gives you some insight into how we prepare for the holiday traffic load spike at Curalate. If you value high availability and low latency in your production systems as we do, check out our jobs page, click the Join Us link on the top right of the page, or shoot us an email at hello@curalate.com.
Thanks for reading!
